Cell-based assays pave the way to obtain complex and biologically relevant data. They can be used to quantify compound cytotoxicity, biochemical mechanisms, biological activity and off-target interactions - in some cases even simultaneously. However, the great potential of cell-based assays can require more work to plan and prepare experiments. When measuring cell-based assays, there can often be additional considerations that one does not face with classical biochemical assays. These considerations may include differences in assay implementation and evaluation. This HowTo Note will highlight some of the potential hurdles associated with cell-based assays and present some tools to overcome them. 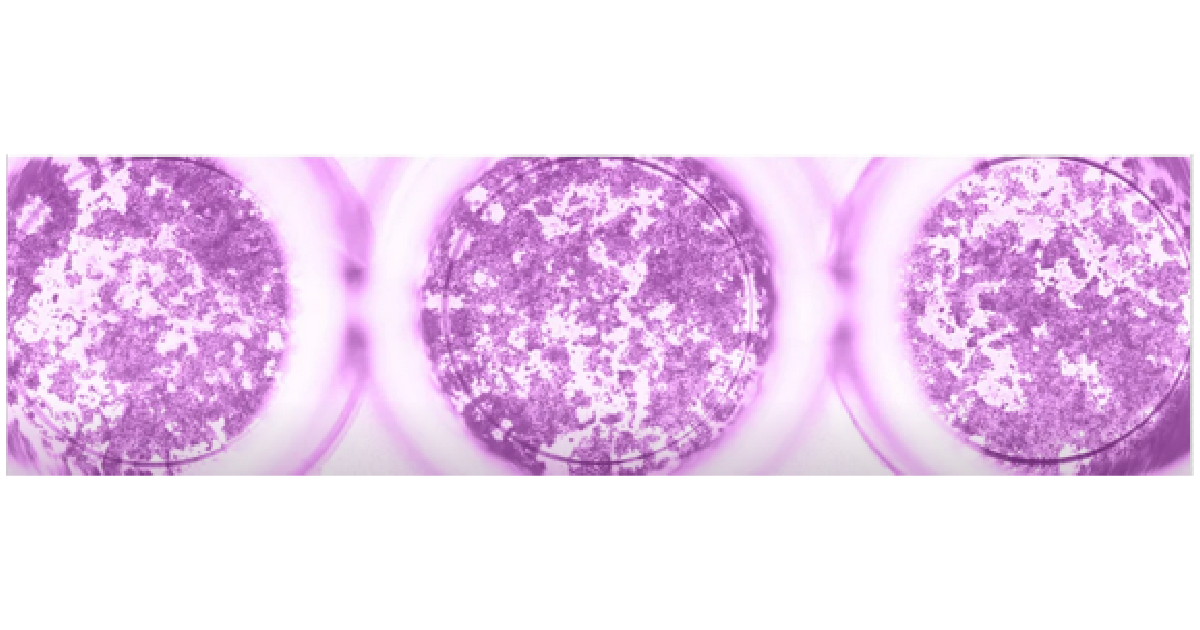
Did you know?
BMG LABTECH’s Atmospheric Control Unit (ACU) allows you to control CO2 and O2 gas concentrations inside the reader in addition to the available temperature control. This transforms your microplate reader into a cell culture incubator and enables live-cell kinetic experiments over several days with maintained cell viability enabling greater physiological relevance to cell-based results.
In this note, we will take a closer look at the heterogeneous nature of cell-based assays. We will highlight the problems arising from the heterogeneity of many cell-based samples and also offer some potential solutions and tools. Most in vitro cell cultures are heterogeneous samples when it comes to microplate reading, although there are some cell-based assays where the dye is found homogeneously in the supernatant such as alamarBlue™ or CellTiter-Glo®. As seen in figure 1, adherent cells can only be found in a thin layer. When measuring intracellular targets or targets on the cell membrane in heterogeneous cell-based assays, further considerations are required in compared with homogeneous liquid samples.
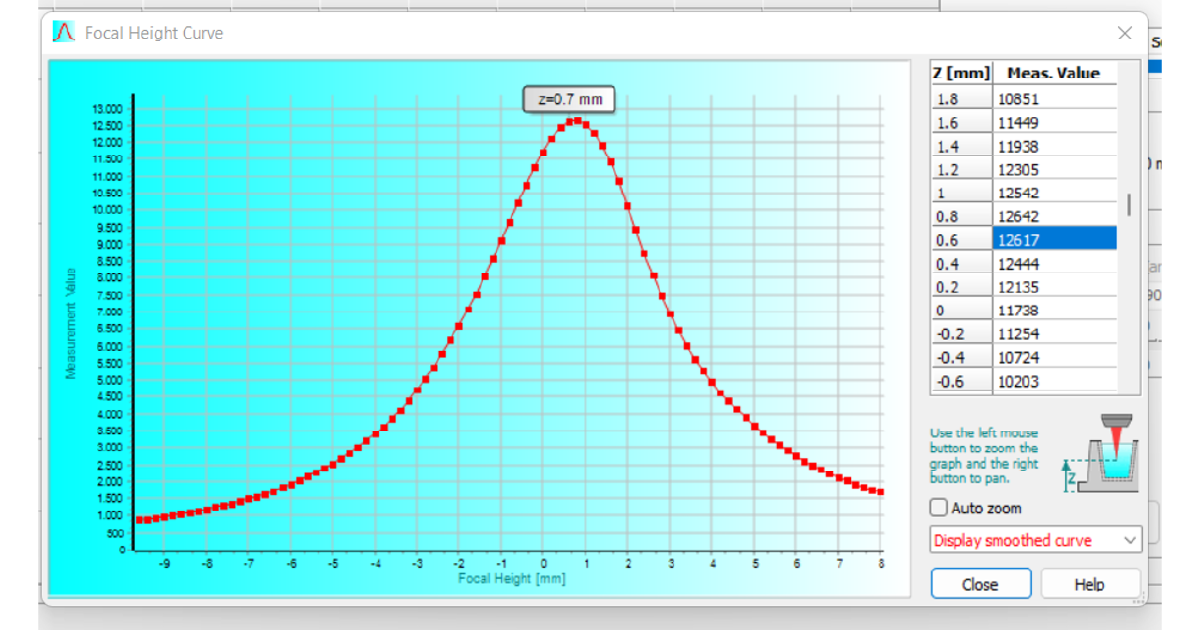
The optimal focal height describes the plane at which the microplate reader can detect the highest signal intensity of a sample. Using an improper focal height for the measurement of your samples will have a negative impact on data quality. Most in vitro cell-based models rely on the use of adherent cell cultures. Cells are typically cultured on the planar bottom in the well of a microplate. For their attachment, the microplate material is regularly treated to generate polar groups on its surface or is coated with components of the cell’s natural extracellular matrix. The detection of cell monolayers comes with an issue: The detection height on the microplate reader must be aligned with the sample´s focal plane providing the maximum signal. The BMG LABTECH software automatically provides a focal height curve, which graphically displays the signal intensity over the different focus levels (fig. 2). As shown in the curve, fluorescence intensity rapidly decreases if the focal height deviates from the optimum by even a fraction of a millimeter.
 The Signal-to-Blank (S/B) ratio on the other hand only decreases when the focal plane of detection moves too much into the solution above the cells (fig. 3). In case of doubt, a lower focal height is recommended rather than a higher one. On BMG LABTECH microplate readers, focal height can be adjusted and optimised when reading from above or below the microplate, meaning users can always benefit from the increased assay quality achieved when using the optimal focal height.
Did you know?
Since adherent cells are located at the bottom of the microplate well, optimal focal heights between 0 and 3 mm are to be expected. The individual focal height depends on the plate used and the thickness of its bottom layer.
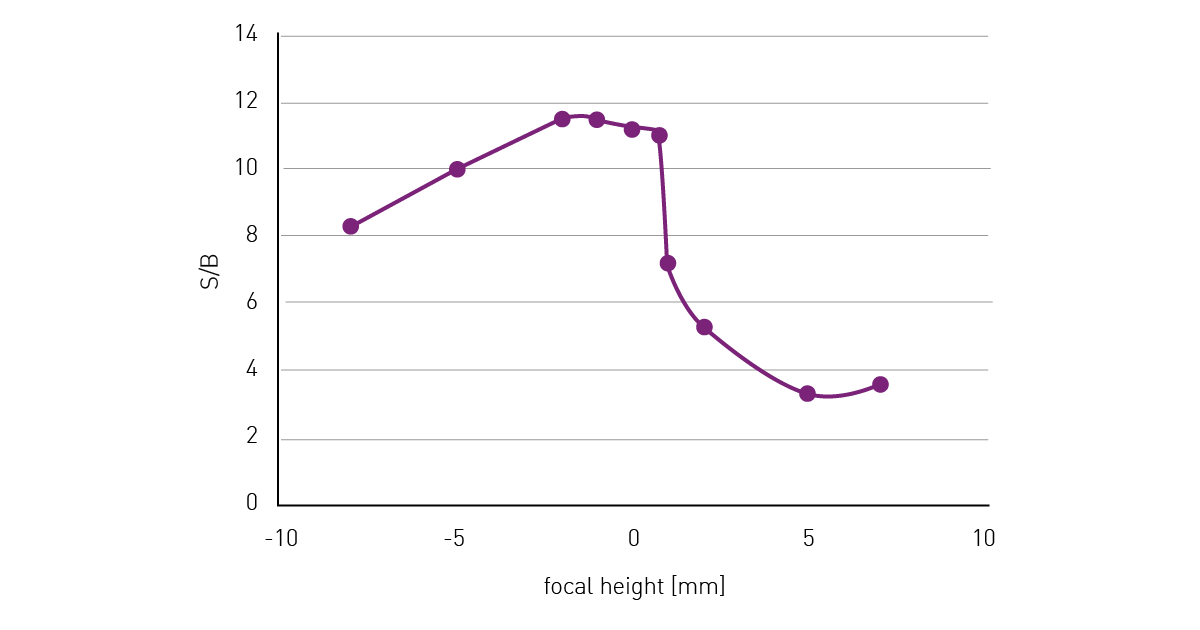 50,000 HeLa cells were seeded per well in a 96-well plate, with 10 replicates and 36 blank wells without cells. After an overnight incubation period, to allow cells to adhere and spread on the well bottom, cells were fixed and stained with Hoechst 33352. The wells were measured at different focal heights with the bottom optics and excitation at 360 and emission at 460 nm. S/B was calculated from the fluorescence signal intensity at different focal heights.
It is always recommended to perform a focal adjustment before a measurement is started. Ideally adjust the focal height on a well with a high number of cells and a high expected signal. If you know you are working with generally low signal intensities and S/B ratios, seed an extra well and cover it with PBS right before the measurement to maximise the available S/B ratio. Use this well for focal adjustment.
As well as being localised to a distinct Z-plane of a well, adherent cells usually also show varying distribution in the X/Y plane. If measurements were only taken from the middle the results could be severely distorted. Cells can be located anywhere across the well bottom and are in most cases unevenly distributed. Especially with lower cell densities or if only a subpopulation includes the target, it is likely that the signal distribution is uneven across the well. Typically, microplate measurements are taken in the centre of each well. In standard fluorescence measurements on a BMG LABTECH microplate reader, 20 flashes will be directed to the centre of each well and the corresponding emission will be read. The results are then provided as the average of these 20 individual measurement points. Cells may not be evenly distributed over the well surface. They may, for example, not be concentrated in the centre of the well and may have settled at the edges. If measurements of fluorescently expressing cells were only taken from the middle the results could be severely distorted. To overcome this problem, BMG LABTECH offers different well scan options for its microplate readers. Next to the classical measurements in the centre of the well, the individual measurement points can be spread across the whole well bottom either in an orbital or spiral scan pattern (fig. 4). 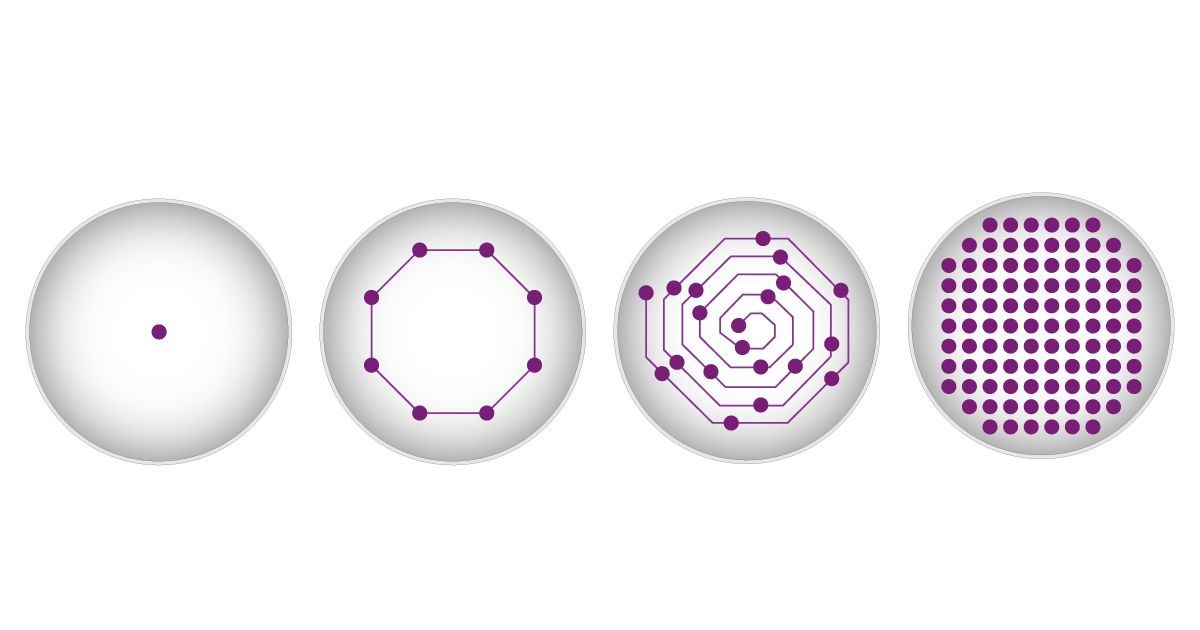
Did you know?
When using the matrix scan option, the reader takes multiple measurements in each well with a resolution of up to 900 points/well (30 x 30 data point matrix). Additionally, you can easily exclude individual scan points or entire sections of the well for evaluation.
This way, the whole surface of the well can be covered with multiple measurement points, leading to more robust and representative measurements and improving reproducibility between replicates. Furthermore, the matrix scan option takes multiple measurements in each well based on a data point matrix. This provides a local resolution of the signal throughout the well and thereby provides the opportunity to monitor seeding homogeneity and local variations of the target signal. BMG LABTECH´s software can display each scan point graphically, creating a 3D heat map for each well.
If the cells are dense and evenly distributed, similar results would be obtained from both middle reading and scan options. However, if the sample is heterogeneous, the scan options can be used to compensate for any variability within the well. Figure 5 shows a matrix scan of green fluorescent protein (GFP)-expressing moss cells. The scan reveals a heterogeneous distribution of the signal or cells in the well, which would have remained undetected if measurements had been acquired exclusively at the centre of the well. The matrix scan feature further enables you to exclude individual points or whole areas from the evaluation.
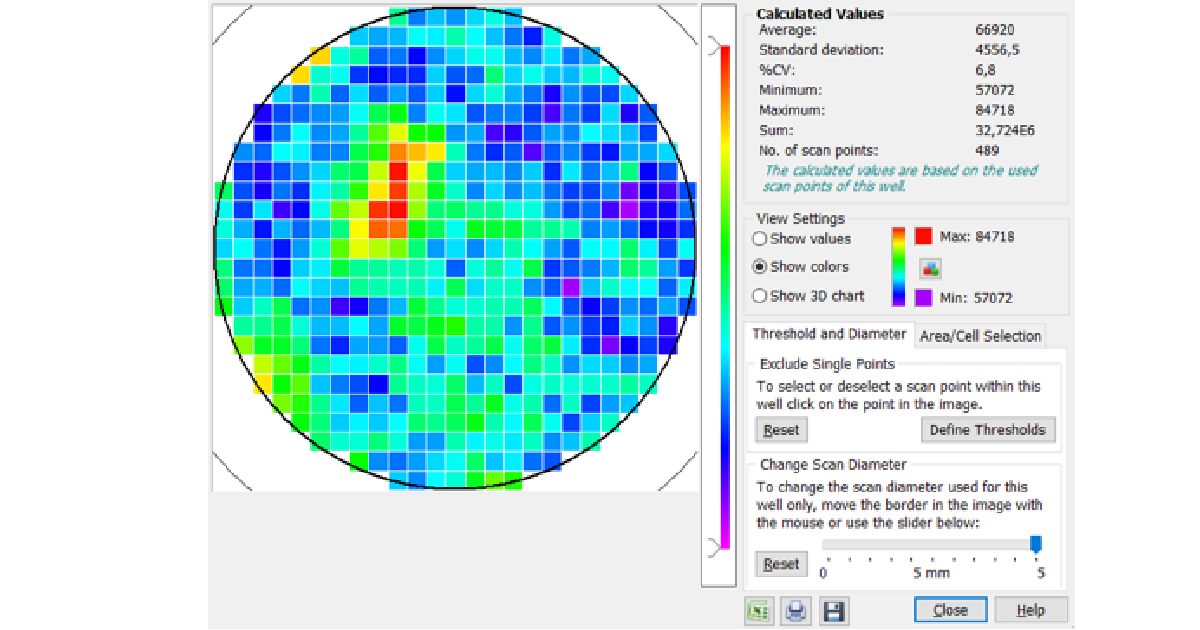
Figure 6 shows 10 replicates measured with both well centre and scanning options. Data variability expressed as %CV is substantially reduced when using all scanning options with best results obtained with matrix scan. Since spiral averaging can cover a larger area of the well, it leads to slightly improved data compared to orbital averaging.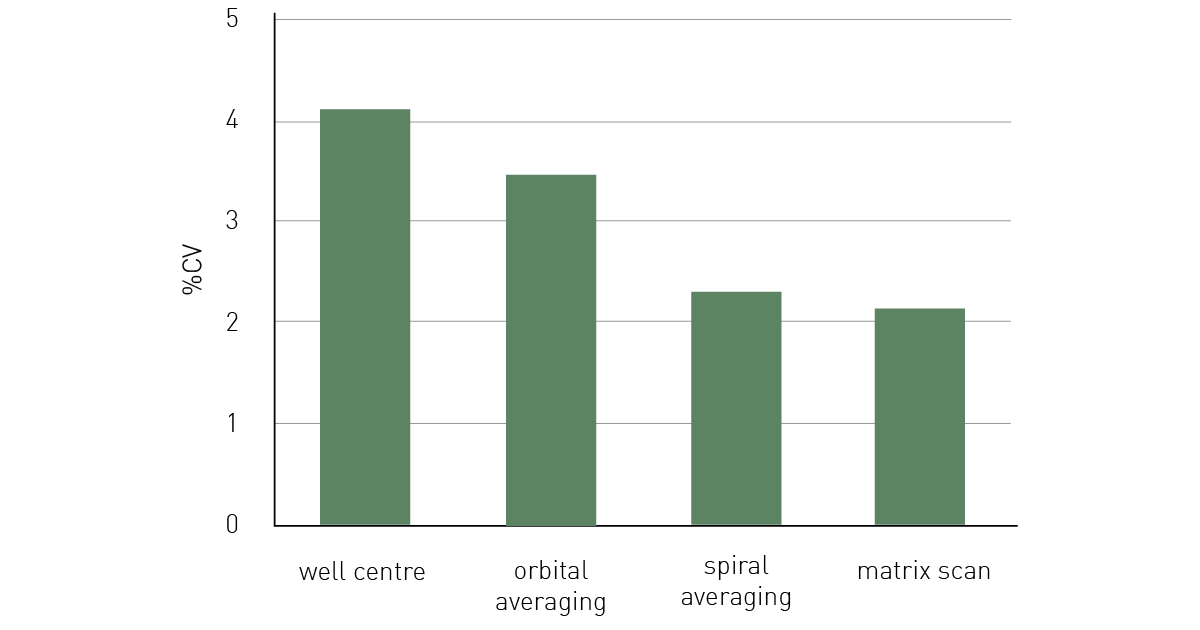 In this example, 50,000 HeLa cells expressing GFP were seeded per well in a 96-well plate, with 10 replicates and 36 blank wells without cells. After an overnight incubation period, to allow cells to adhere and spread on the well bottom, cells were measured in FluoroBrite™ medium, with excitation at 482 and emission at 530 nm, and bottom optics using different well scan options. Each of the scan options shows reduced data variability (%CV) over the measurement in the centre of the well.
Conclusion
The main recommendations for the fluorescence measurement of heterogeneous cell-based samples are summarised here:
- Always perform a focal height adjustment when working with adherent cells
- Adherent cell-based assays often benefit from the application of a well-scanning mode to correct for a heterogeneous signal distribution in the well
- The application of a matrix scan provides you with a local resolution of the signal throughout the well and thereby gives the opportunity to monitor seeding homogeneity and local variations of the target signal
- The matrix scan feature further enables you to exclude individual points or whole areas from the evaluation.
- Initial recommendation
- Detailed Recommendation